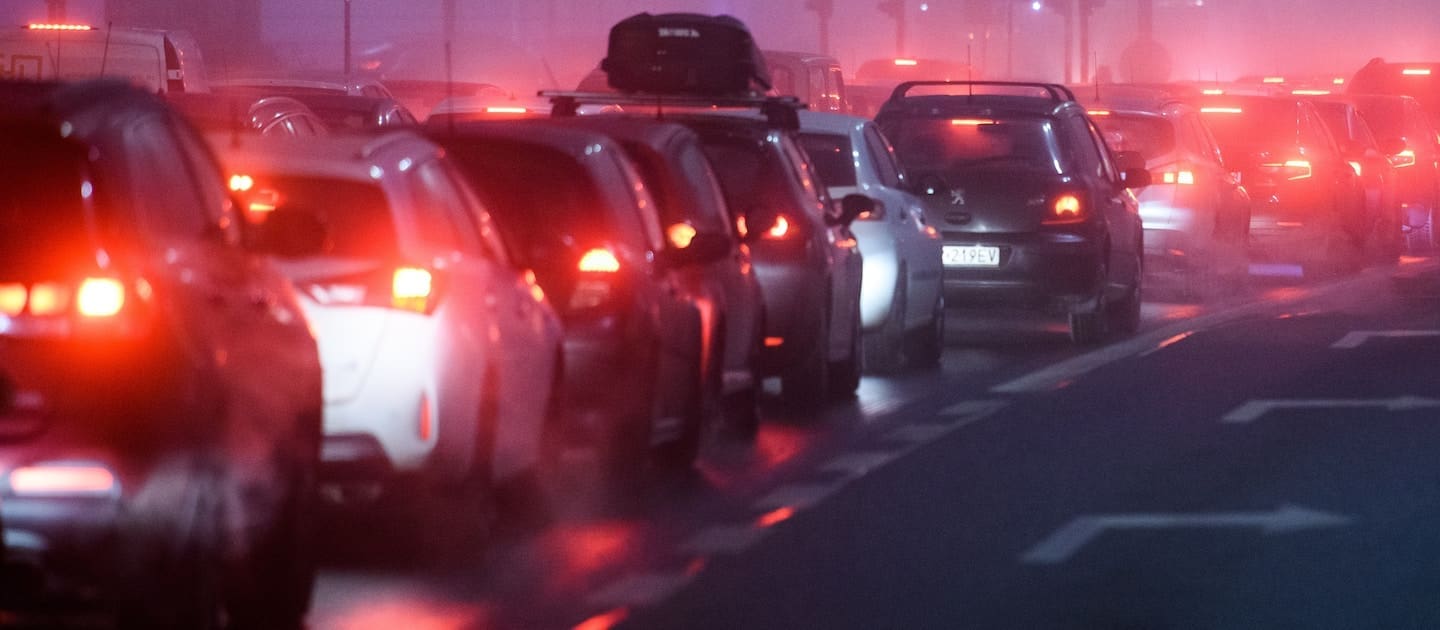

Delaware drivers are the least likely to have experienced road rage, a new nationwide survey concluded. (Jacek Dylag photo from Unsplash)
Delaware ranks No. 1 among the states for the most polite drivers, a new survey has found.
Forbes Advisor surveyed 10,000 licensed drivers who own at least one car on nine metrics. At least 200 were interviewed in each state.
Arizona got the dishonor of having the worst road rage, with Rhode Island second. The map that accompanies the survey shows no geographic pattern to politeness or confrontation. Maryland, New Jersey and Pennsylvania were in the the middle of the pack.
- 41% of Delaware drivers said other drivers had yelled at them, insulted them or threatened them (less than half the rate of Rhode Island).
- 28.5% had experienced rude or offensive gestures (the nation’s second lowest).
- 28% said another drive has honked at them in frustration (the nation’s lowest).
- 24.5% said other drivers had blocked them from changing lanes (a fifth of the rate of Rhode Island).
- 11% said other drivers had cut them off on purpose (the nation’s lowest).
- 5% said other drivers had forced them off the road (a quarter of the rate of Arizona).
“Violent road rage incidents are on the rise nationwide,” Forbes Advisor wrote. “In 2022, 413 people were injured in road rage shootings, a 135% increase from 2018.”
Road rages matters, Forbes Advisor wrote, because “the national average car insurance rate increase is 45% after an accident with property damage and 47% for causing an accident that results in injuries.”
Among the drivers surveyed, the top reasons cited for feeling road rage:
- Heavy traffic (39.35%)
- Already feeling stressed (38.06%)
- Running late (33.89%)
- Already feeling angry (32.49%)
- Feeling tired (26.86%)Among the drivers surveyed, the top locations for feeling road rage:
- City streets (29.18%).
Among the drivers surveyed, the top locations for feeling road rage:
- Freeways or highways (26.59%)
- Parking lots (14.9%)
- Intersections (12.36%)
- Rural roads (6.99%)
How the road rage survey was conducted
The nine metrics were weighted.
- Percentage of drivers who report that another driver has forced their car off the road: 16% of score.
- Percentage of drivers who report that another driver has exited their vehicle to yell at or fight with them: 16% of score.
- Percentage of drivers who report experiencing road rage very frequently from other drivers in their home state: 14% of score.
- Percentage of drivers who report that another driver has tried to block their car from changing lanes: 14% of score.
- Percentage of drivers who report that another driver has cut them off on purpose: 14% of score.
- Percentage of drivers who report that another driver has tailgated their car: 8% of score.
- Percentage of drivers who report that another driver has yelled at them, insulted them, cursed at them or made threats: 6% of score.
- Percentage of drivers who report that another driver has honked at them in frustration: 6% of score.
- Percentage of drivers who report that another driver has made rude or offensive gestures at them: 6% of score.
The survey was conducted by market research company OnePoll, in accordance with the Market Research Society’s code of conduct. Data was collected between July 7 and Aug. 3. The margin of error is +/- 2.2 points with 95% confidence.
some info
Share this Post


